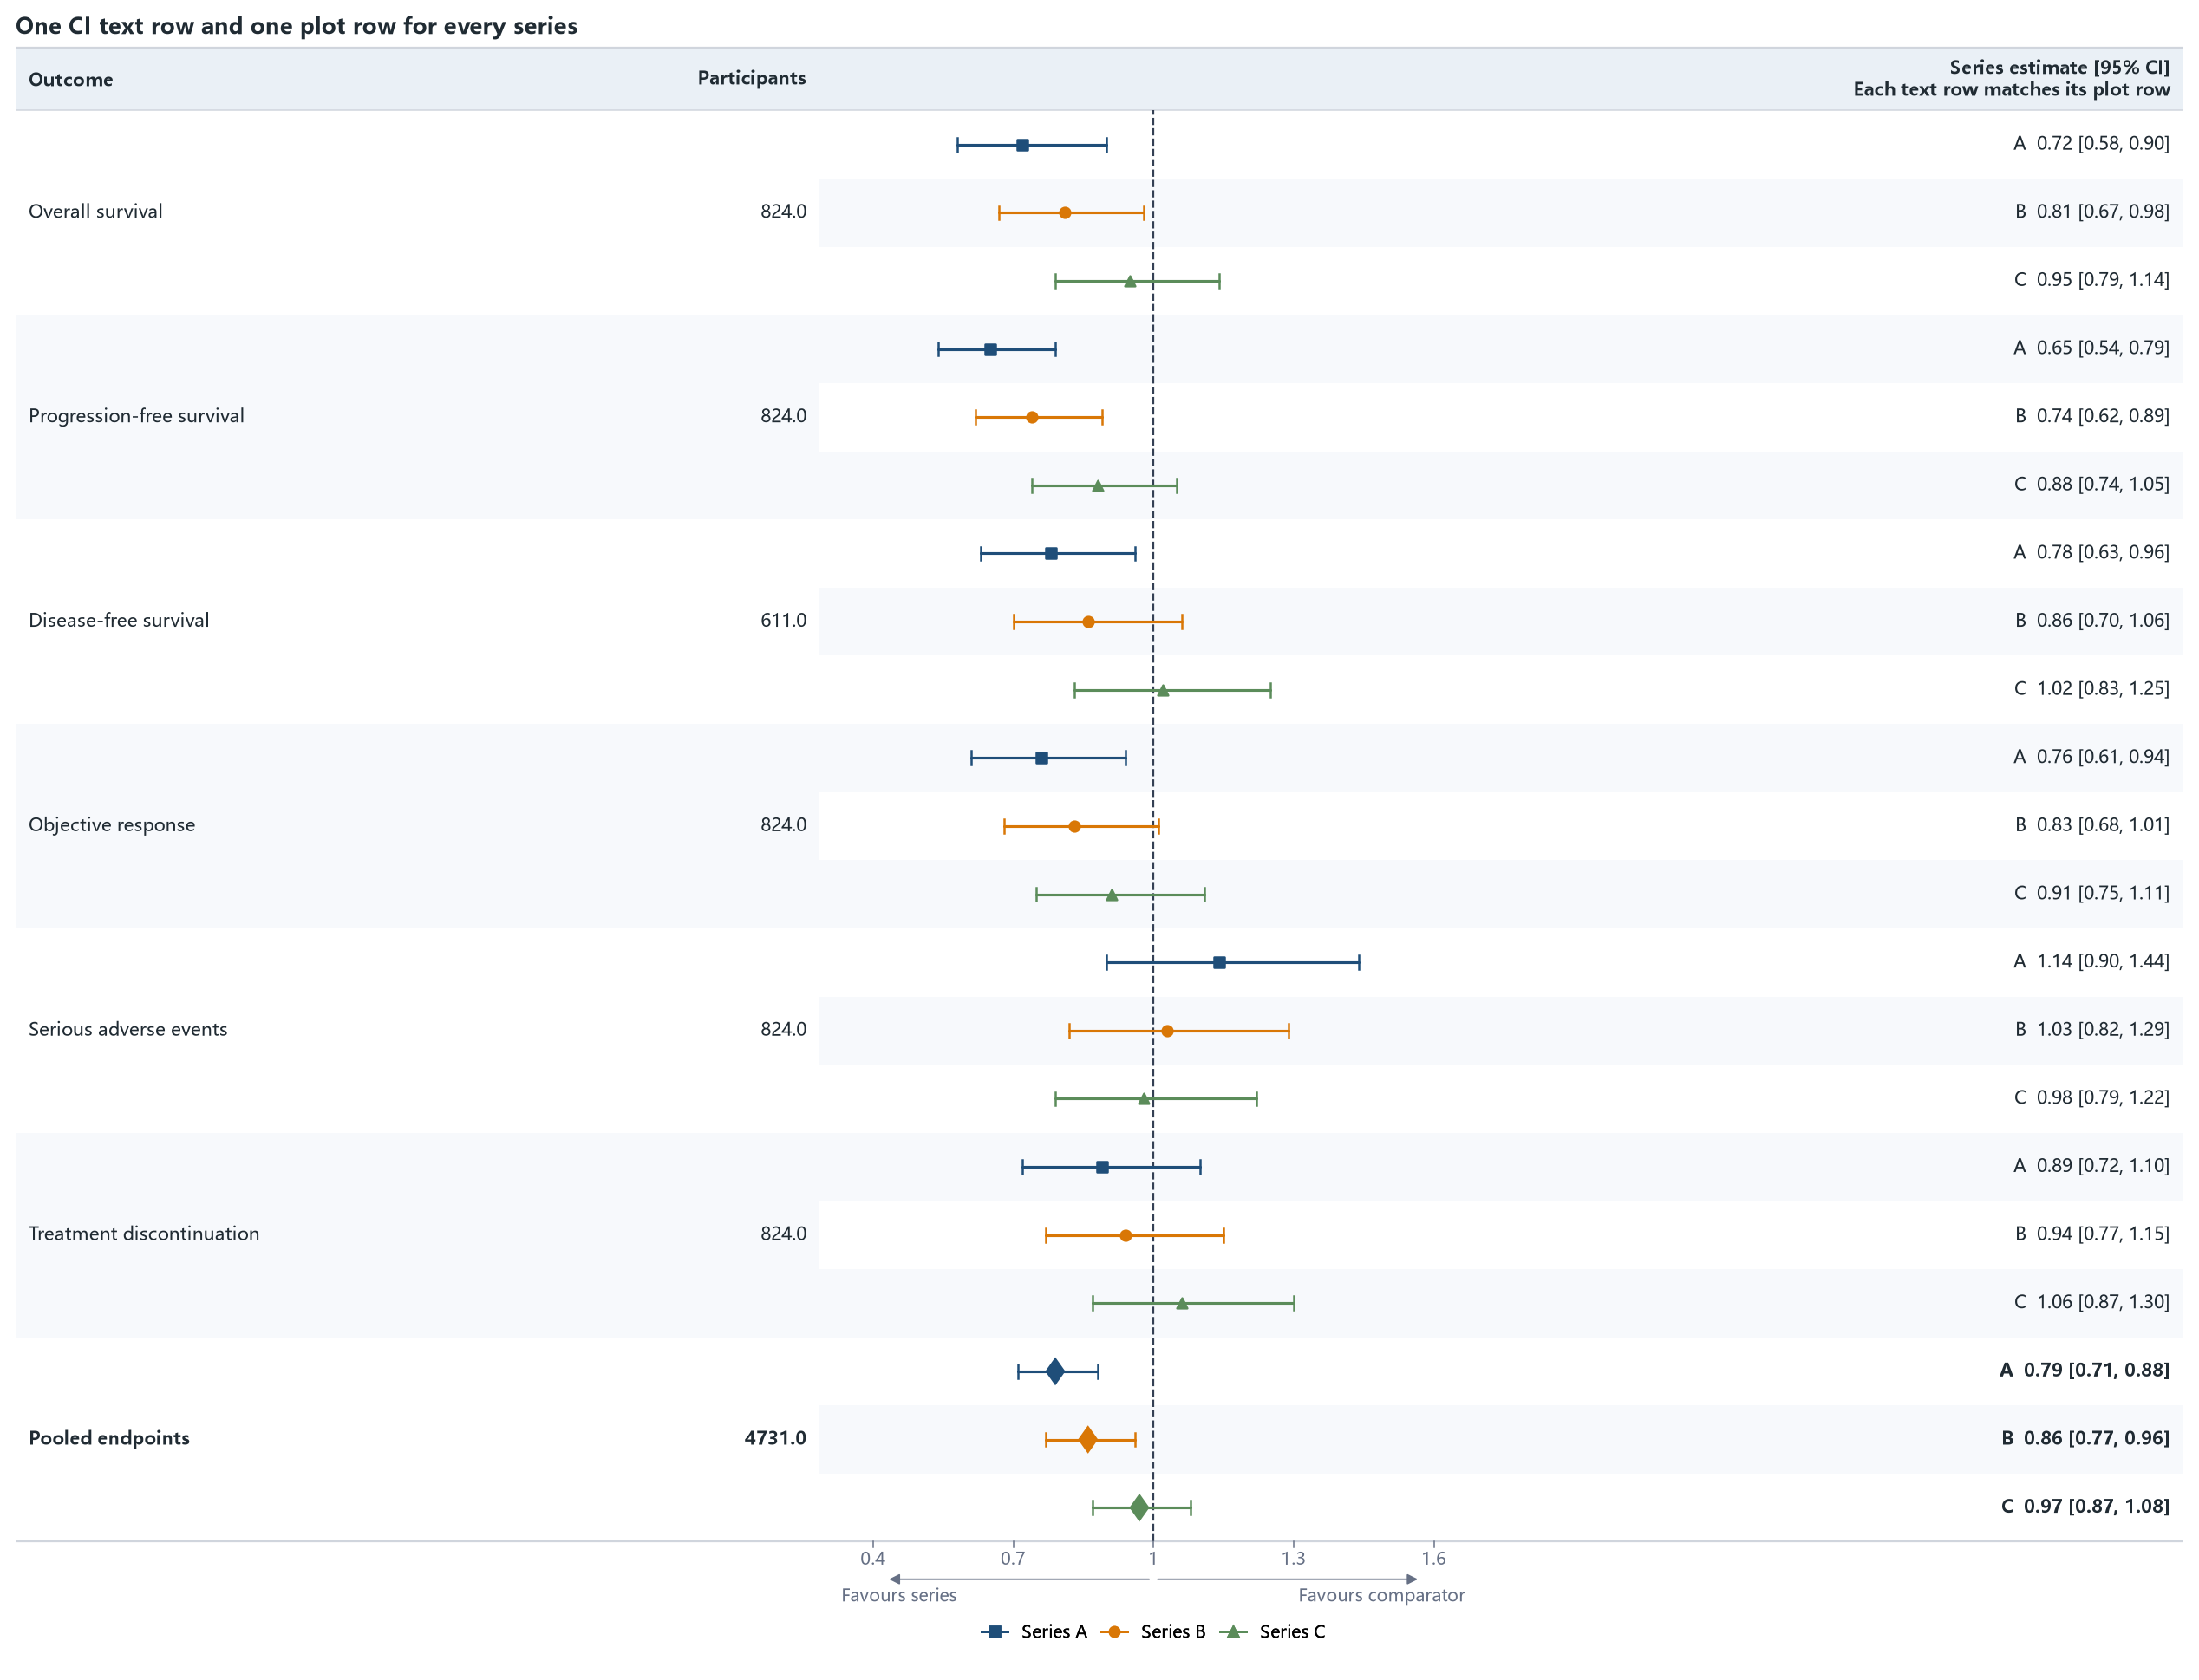
12 · Per-series CI text rows after the plot
Each of three series has its own formatted CI text cell and its own
_plot_row. The text column follows the CI plotting column, and every text
artist shares the exact y coordinate of its corresponding point and interval.
Run the example
from forestploter import read_forest_data
from forestploter.gallery_cases import plot_multi_series_ci_text_rows

df = read_forest_data("12_multi_series_ci_text_rows.xlsx", sheet_name="Forest")
result = plot_multi_series_ci_text_rows(df)
result.save("12_multi_series_ci_text_rows.png", dpi=300)
Plot function used by the gallery and tests
def plot_multi_series_ci_text_rows(df: ForestInput) -> ForestPlotResult:
    """Plot case 12: one CI text and plot row for every series."""

    columns = (
        ForestColumn("outcome", "Outcome", "text", 2.5),
        ForestColumn("participants", "Participants", "numeric", 0.8, "right"),
        ForestColumn("ci", "", "ci", 4.8, "center"),
        ForestColumn(
            "series_ci_text",
            "Series estimate [95% CI]\nEach text row matches its plot row",
            "numeric",
            2.8,
            "right",
        ),
    )
    styles = {
        "Series A": ForestSeriesStyle("Series A", "#1F4E79", marker="s"),
        "Series B": ForestSeriesStyle("Series B", "#D97706", marker="o"),
        "Series C": ForestSeriesStyle("Series C", "#5B8C5A", marker="^"),
    }
    return forest(
        df,
        columns=columns,
        ref_line=1.0,
        xlim=(0.4, 1.6),
        ticks_at=(0.4, 0.7, 1.0, 1.3, 1.6),
        arrow_lab=("Favours series", "Favours comparator"),
        title="One CI text row and one plot row for every series",
        figure_width=14.0,
        series_styles=styles,
        legend=ForestLegendSpec(location="bottom", ncol=3),
    )