04 · Clipping stress test
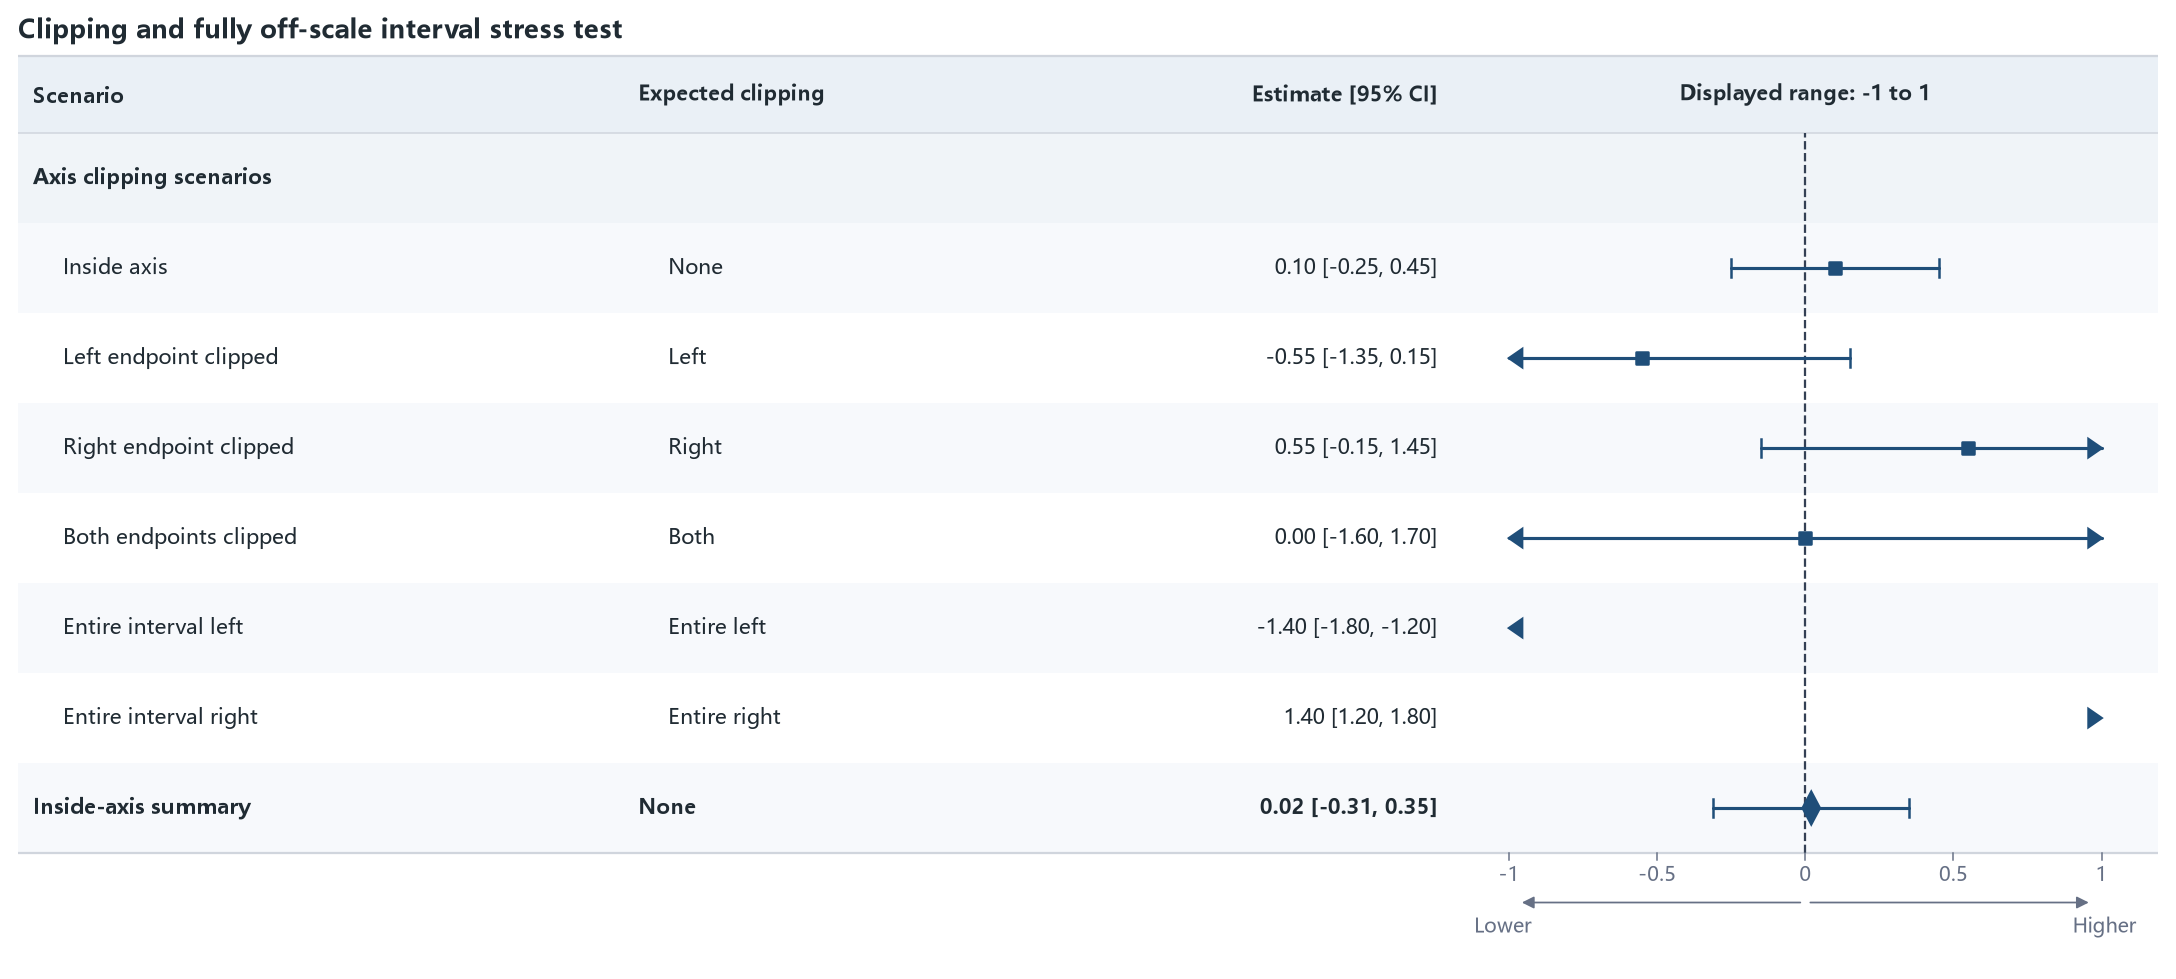
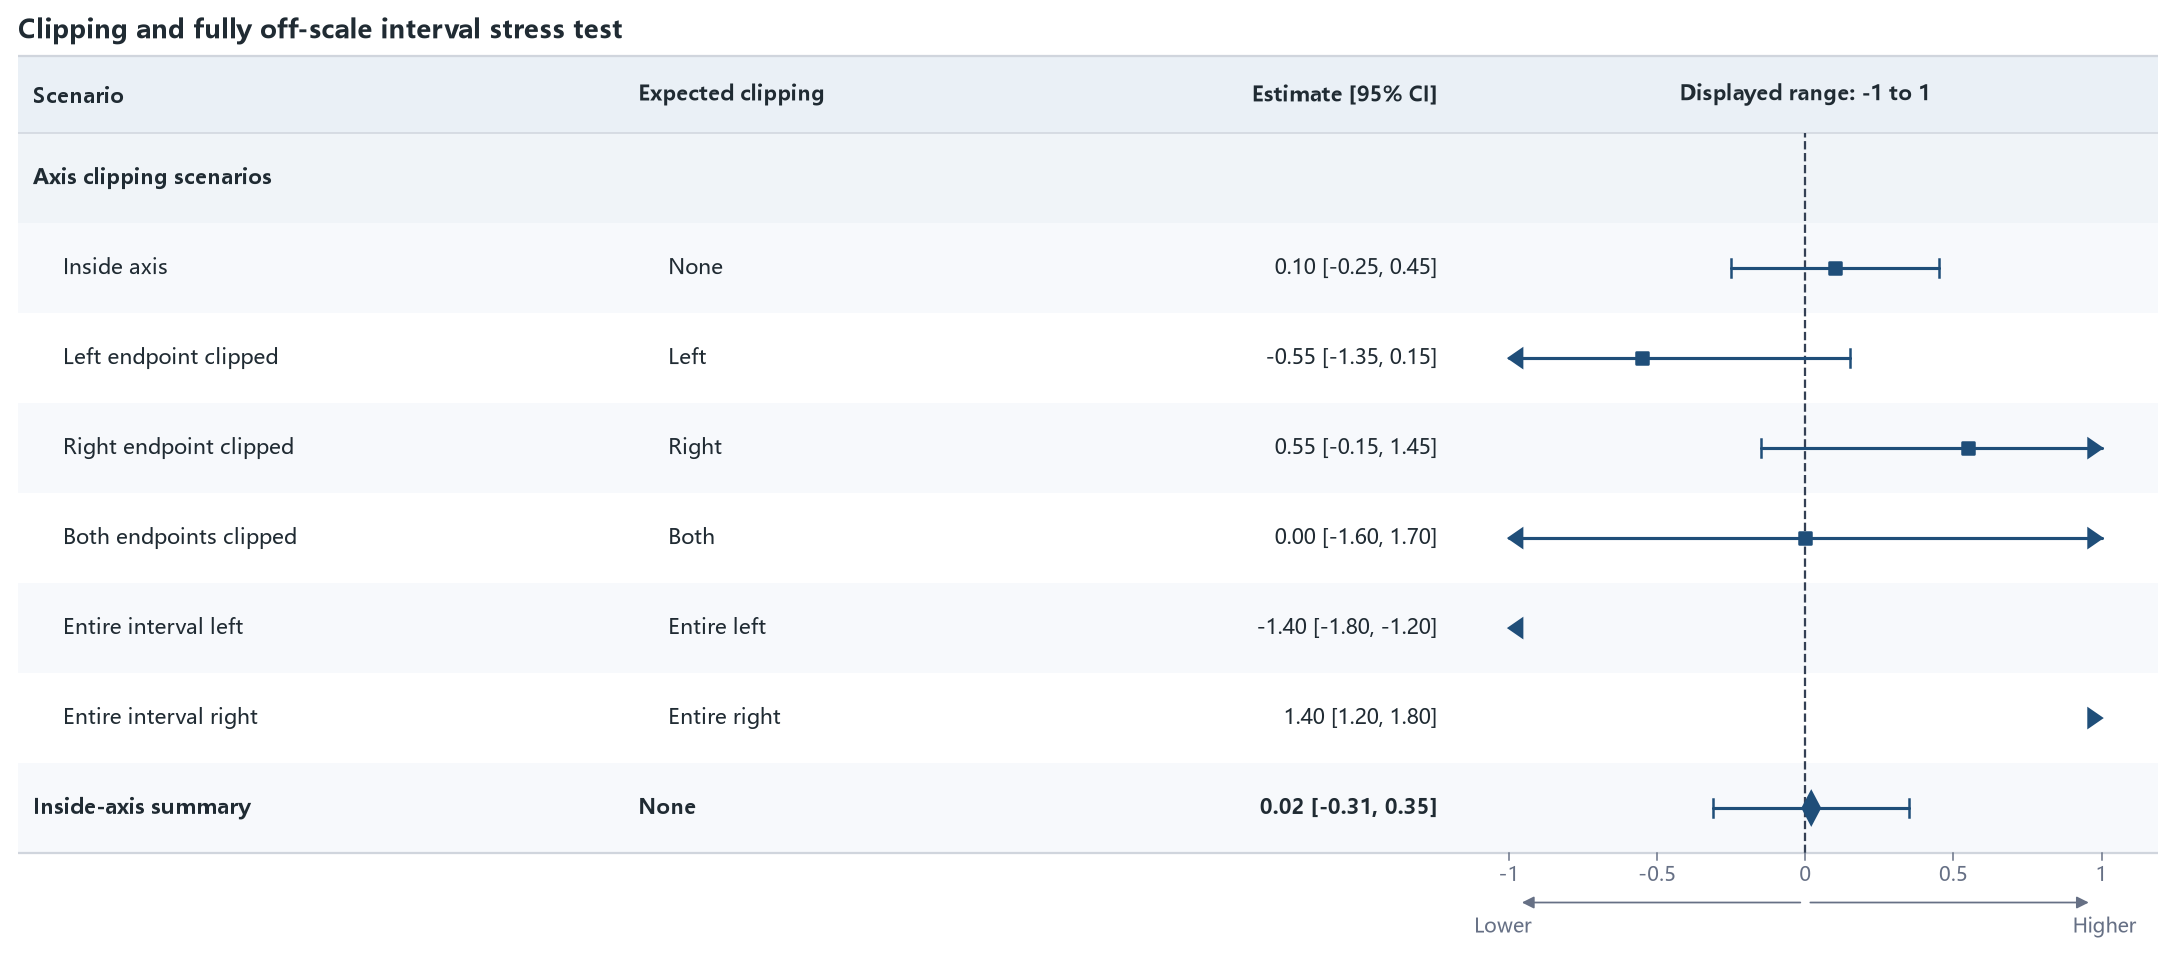
This case covers intervals inside the axis, clipped on either side, spanning both sides, and entirely outside the displayed range. An arrow replaces the cap on each clipped side.
Run the example
from forestploter import read_forest_data
from forestploter.gallery_cases import plot_clipping_stress

df = read_forest_data("04_clipping_stress.xlsx", sheet_name="Forest")
result = plot_clipping_stress(df)
result.save("04_clipping_stress.png", dpi=300)
Plot function used by the gallery and tests
def plot_clipping_stress(df: ForestInput) -> ForestPlotResult:
    """Plot case 04: partially and fully off-scale intervals."""

    columns = (
        ForestColumn("scenario", "Scenario", "text", 2.4),
        ForestColumn("expected_clipping", "Expected clipping", "text", 1.2),
        ForestColumn("interval_display", "Estimate [95% CI]", "numeric", 1.8, "right"),
        ForestColumn("ci", "Displayed range: -1 to 1", "ci", 3.2, "center"),
    )
    return forest(
        df,
        columns=columns,
        ref_line=0.0,
        xlim=(-1.0, 1.0),
        ticks_at=(-1.0, -0.5, 0.0, 0.5, 1.0),
        arrow_lab=("Lower", "Higher"),
        title="Clipping and fully off-scale interval stress test",
        figure_width=12.0,
    )