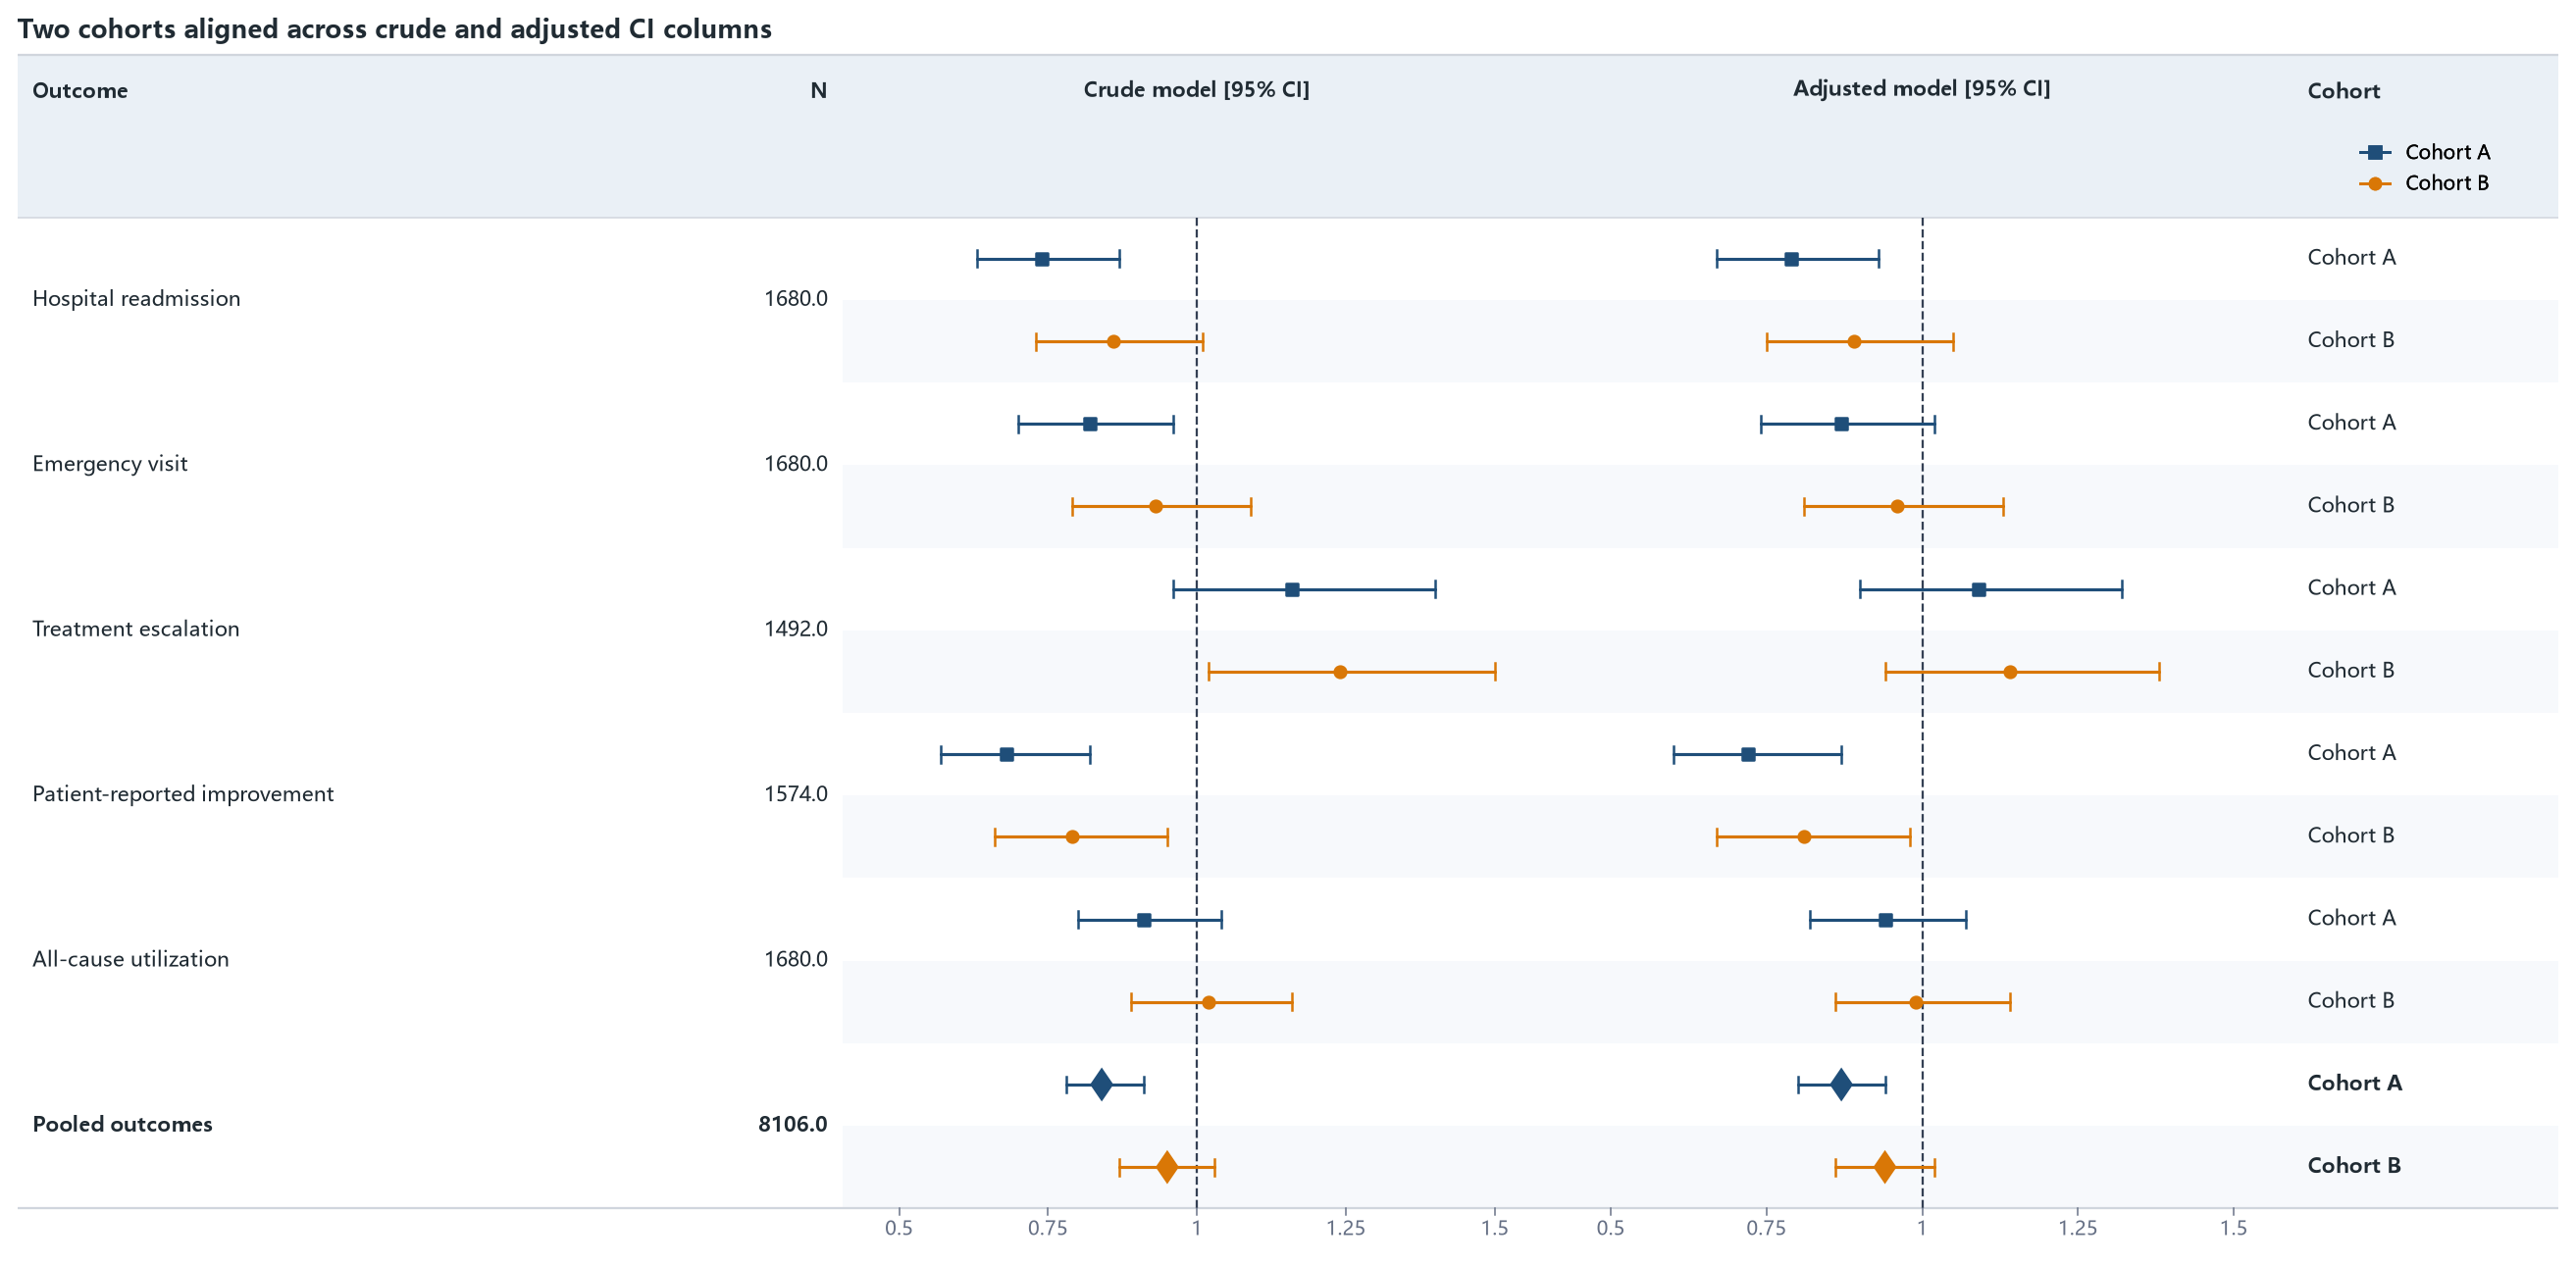
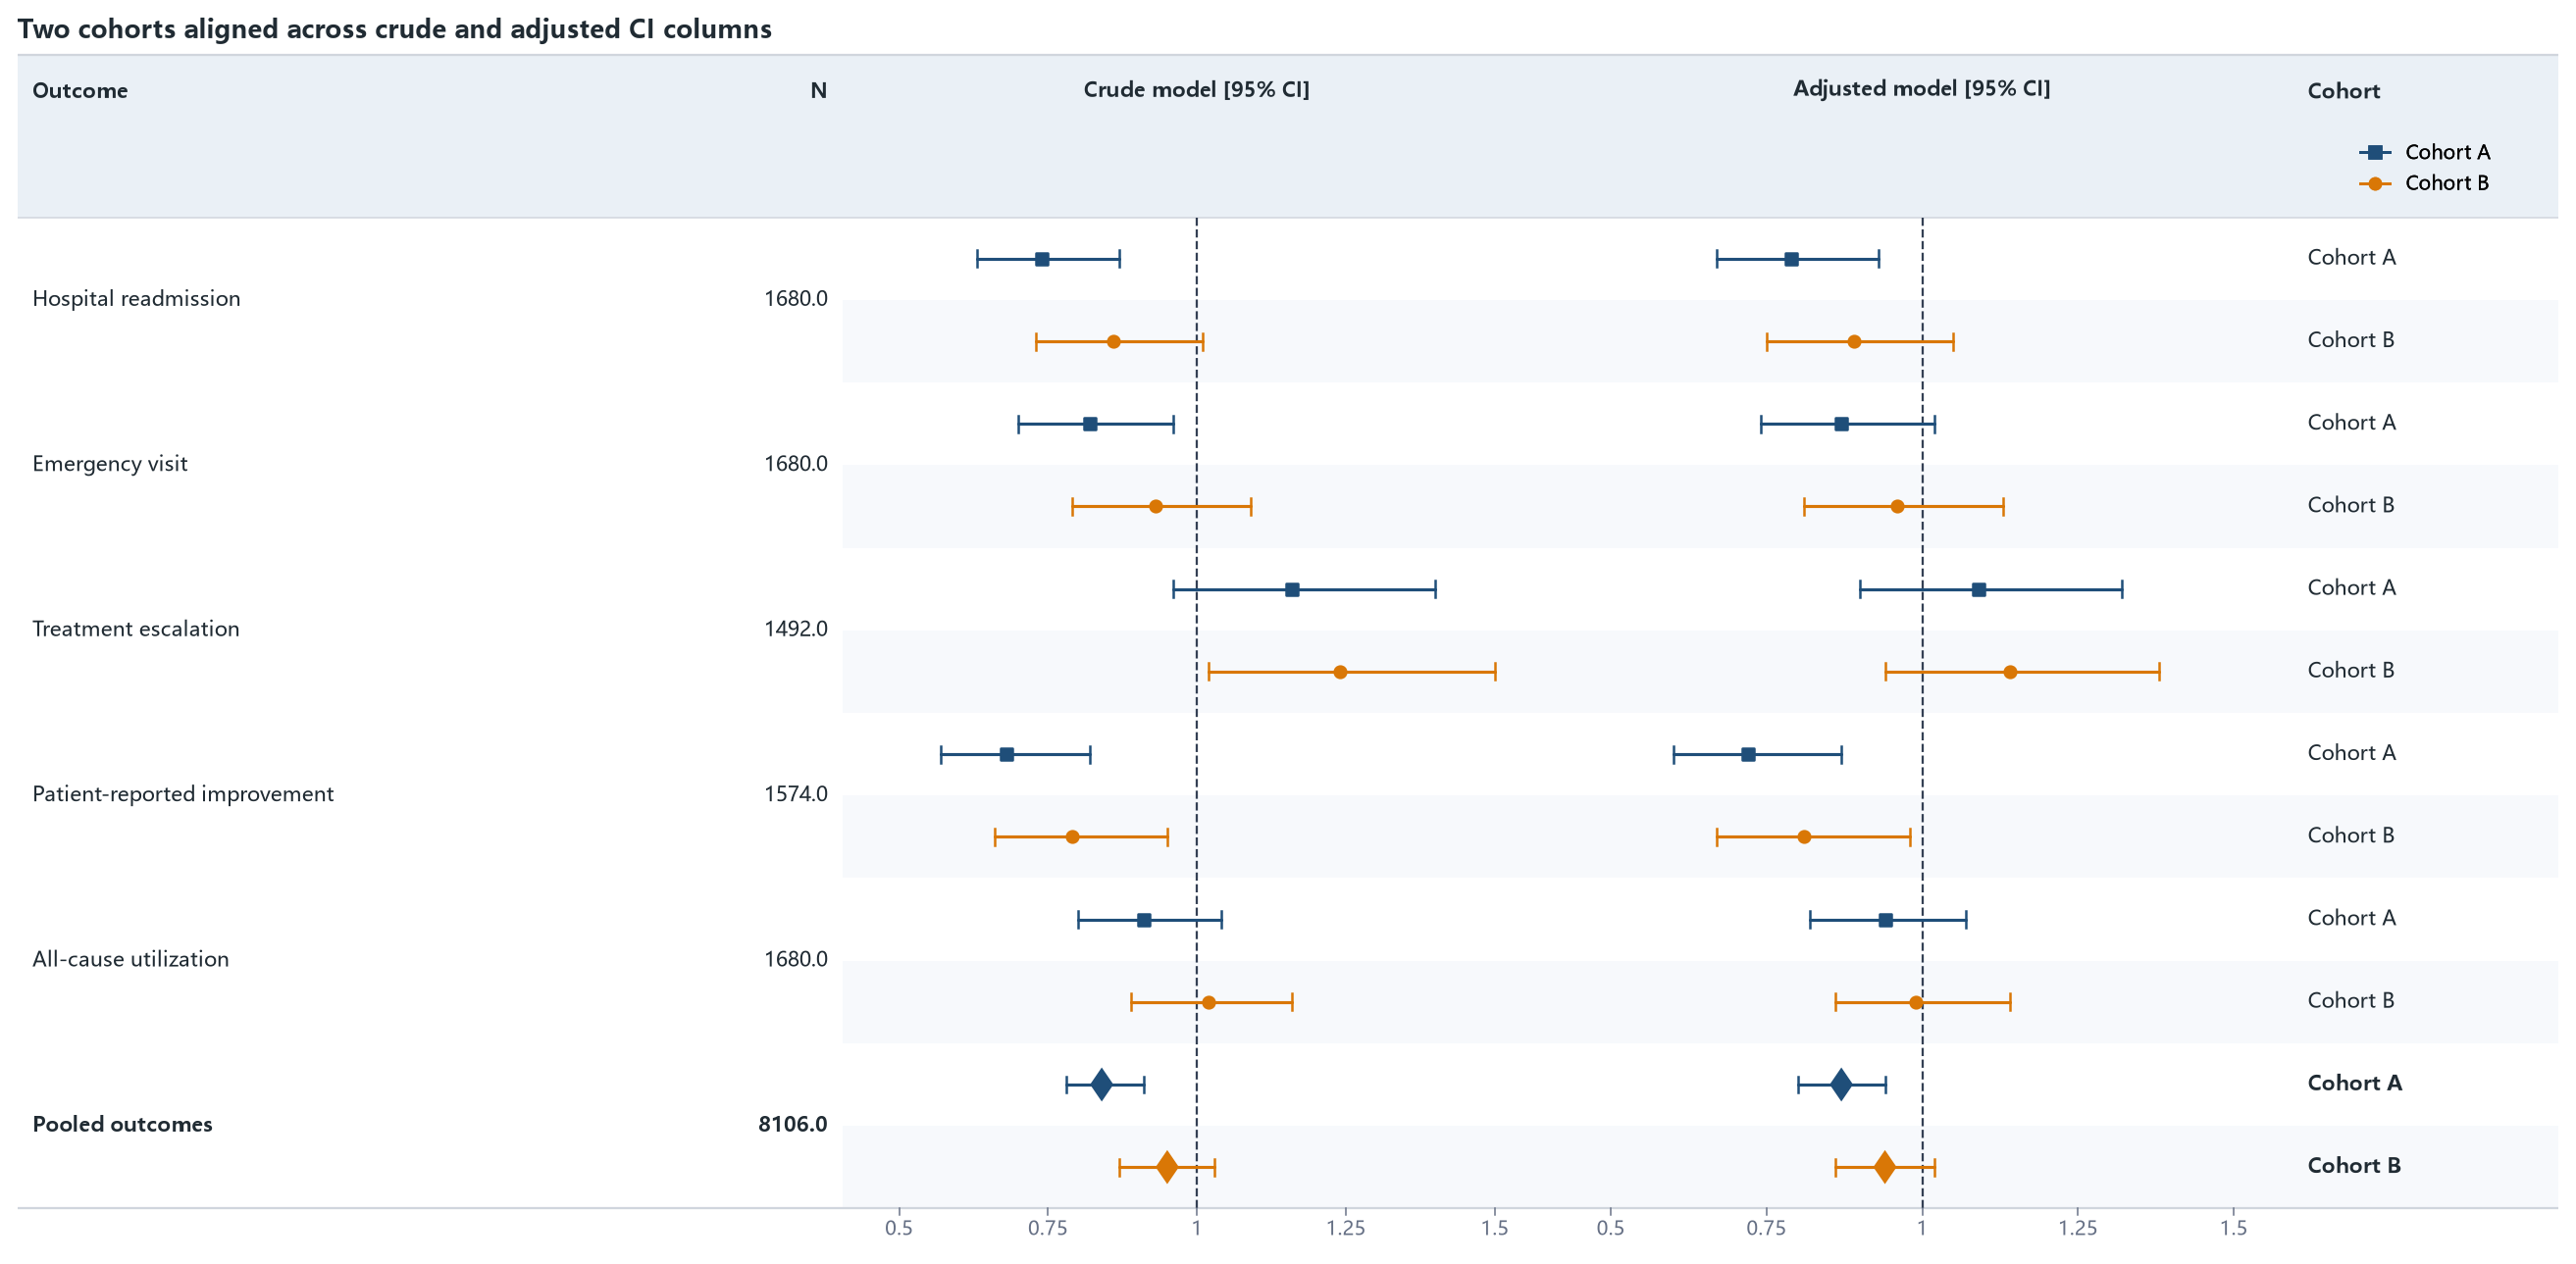
08 · Two series across two CI columns, then text
Each cohort has one visual row and two source records, one per CI column. The
cohort display field is physically placed after the shared statistical
triple and rendered after both CI columns. The series legend is placed in that
trailing column’s header.
Run the example
from forestploter import read_forest_data
from forestploter.gallery_cases import plot_two_by_two_ci_columns

df = read_forest_data("08_two_by_two_ci_columns.xlsx", sheet_name="Forest")
result = plot_two_by_two_ci_columns(df)
result.save("08_two_by_two_ci_columns.png", dpi=300)
Plot function used by the gallery and tests
def plot_two_by_two_ci_columns(df: ForestInput) -> ForestPlotResult:
    """Plot case 08: two series, two aligned CI columns, then text."""

    columns = (
        ForestColumn("outcome", "Outcome", "text", 2.4),
        ForestColumn("n", "N", "numeric", 0.6, "right"),
        ForestColumn("ci_crude", "Crude model [95% CI]", "ci", 3.4, "center"),
        ForestColumn("ci_adjusted", "Adjusted model [95% CI]", "ci", 3.4, "center"),
        ForestColumn("cohort", "Cohort", "text", 1.1),
    )
    styles = {
        "Cohort A": ForestSeriesStyle("Cohort A", "#1F4E79", marker="s"),
        "Cohort B": ForestSeriesStyle("Cohort B", "#D97706", marker="o"),
    }
    return forest(
        df,
        columns=columns,
        ref_line=1.0,
        xlim=(0.5, 1.5),
        ticks_at=(0.5, 0.75, 1.0, 1.25, 1.5),
        title="Two cohorts aligned across crude and adjusted CI columns",
        figure_width=14.5,
        series_styles=styles,
        legend=ForestLegendSpec(location="header", column_key="cohort", ncol=1),
    )