07 · Four dense series
Four marker shapes, four explicit visual rows per endpoint, summary rows, a bottom legend, and a clipped upper interval form a dense regression case.
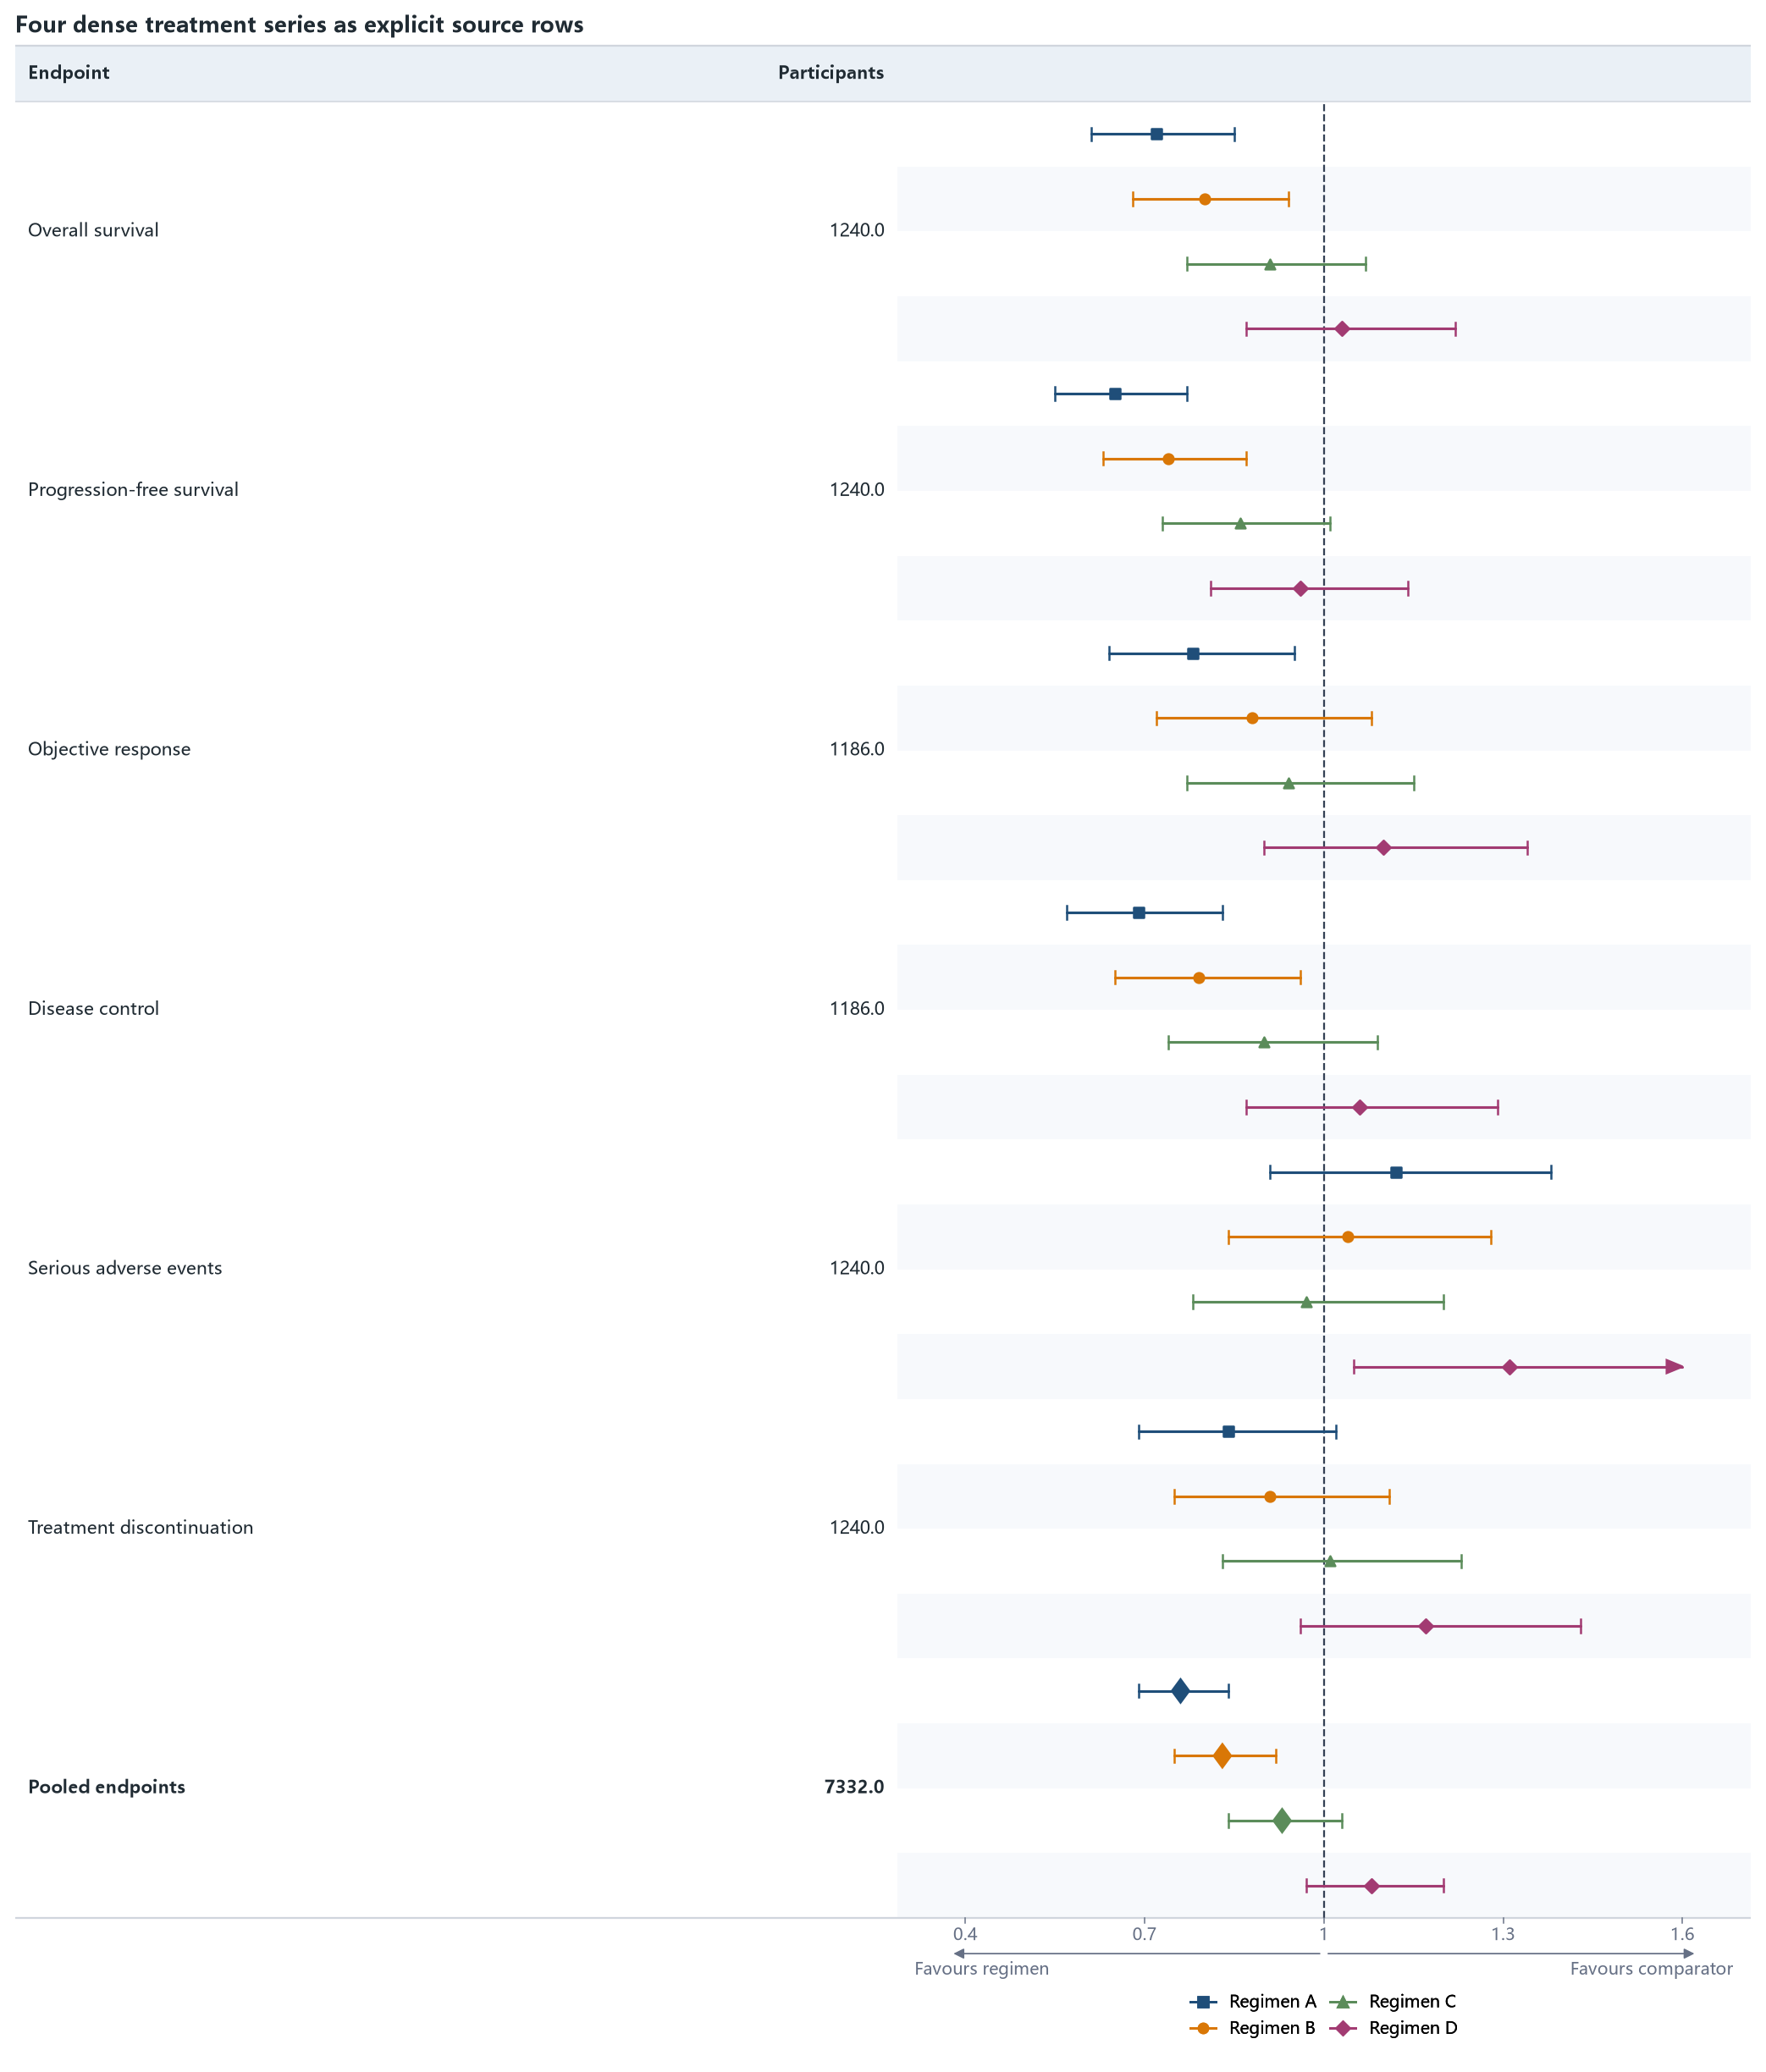
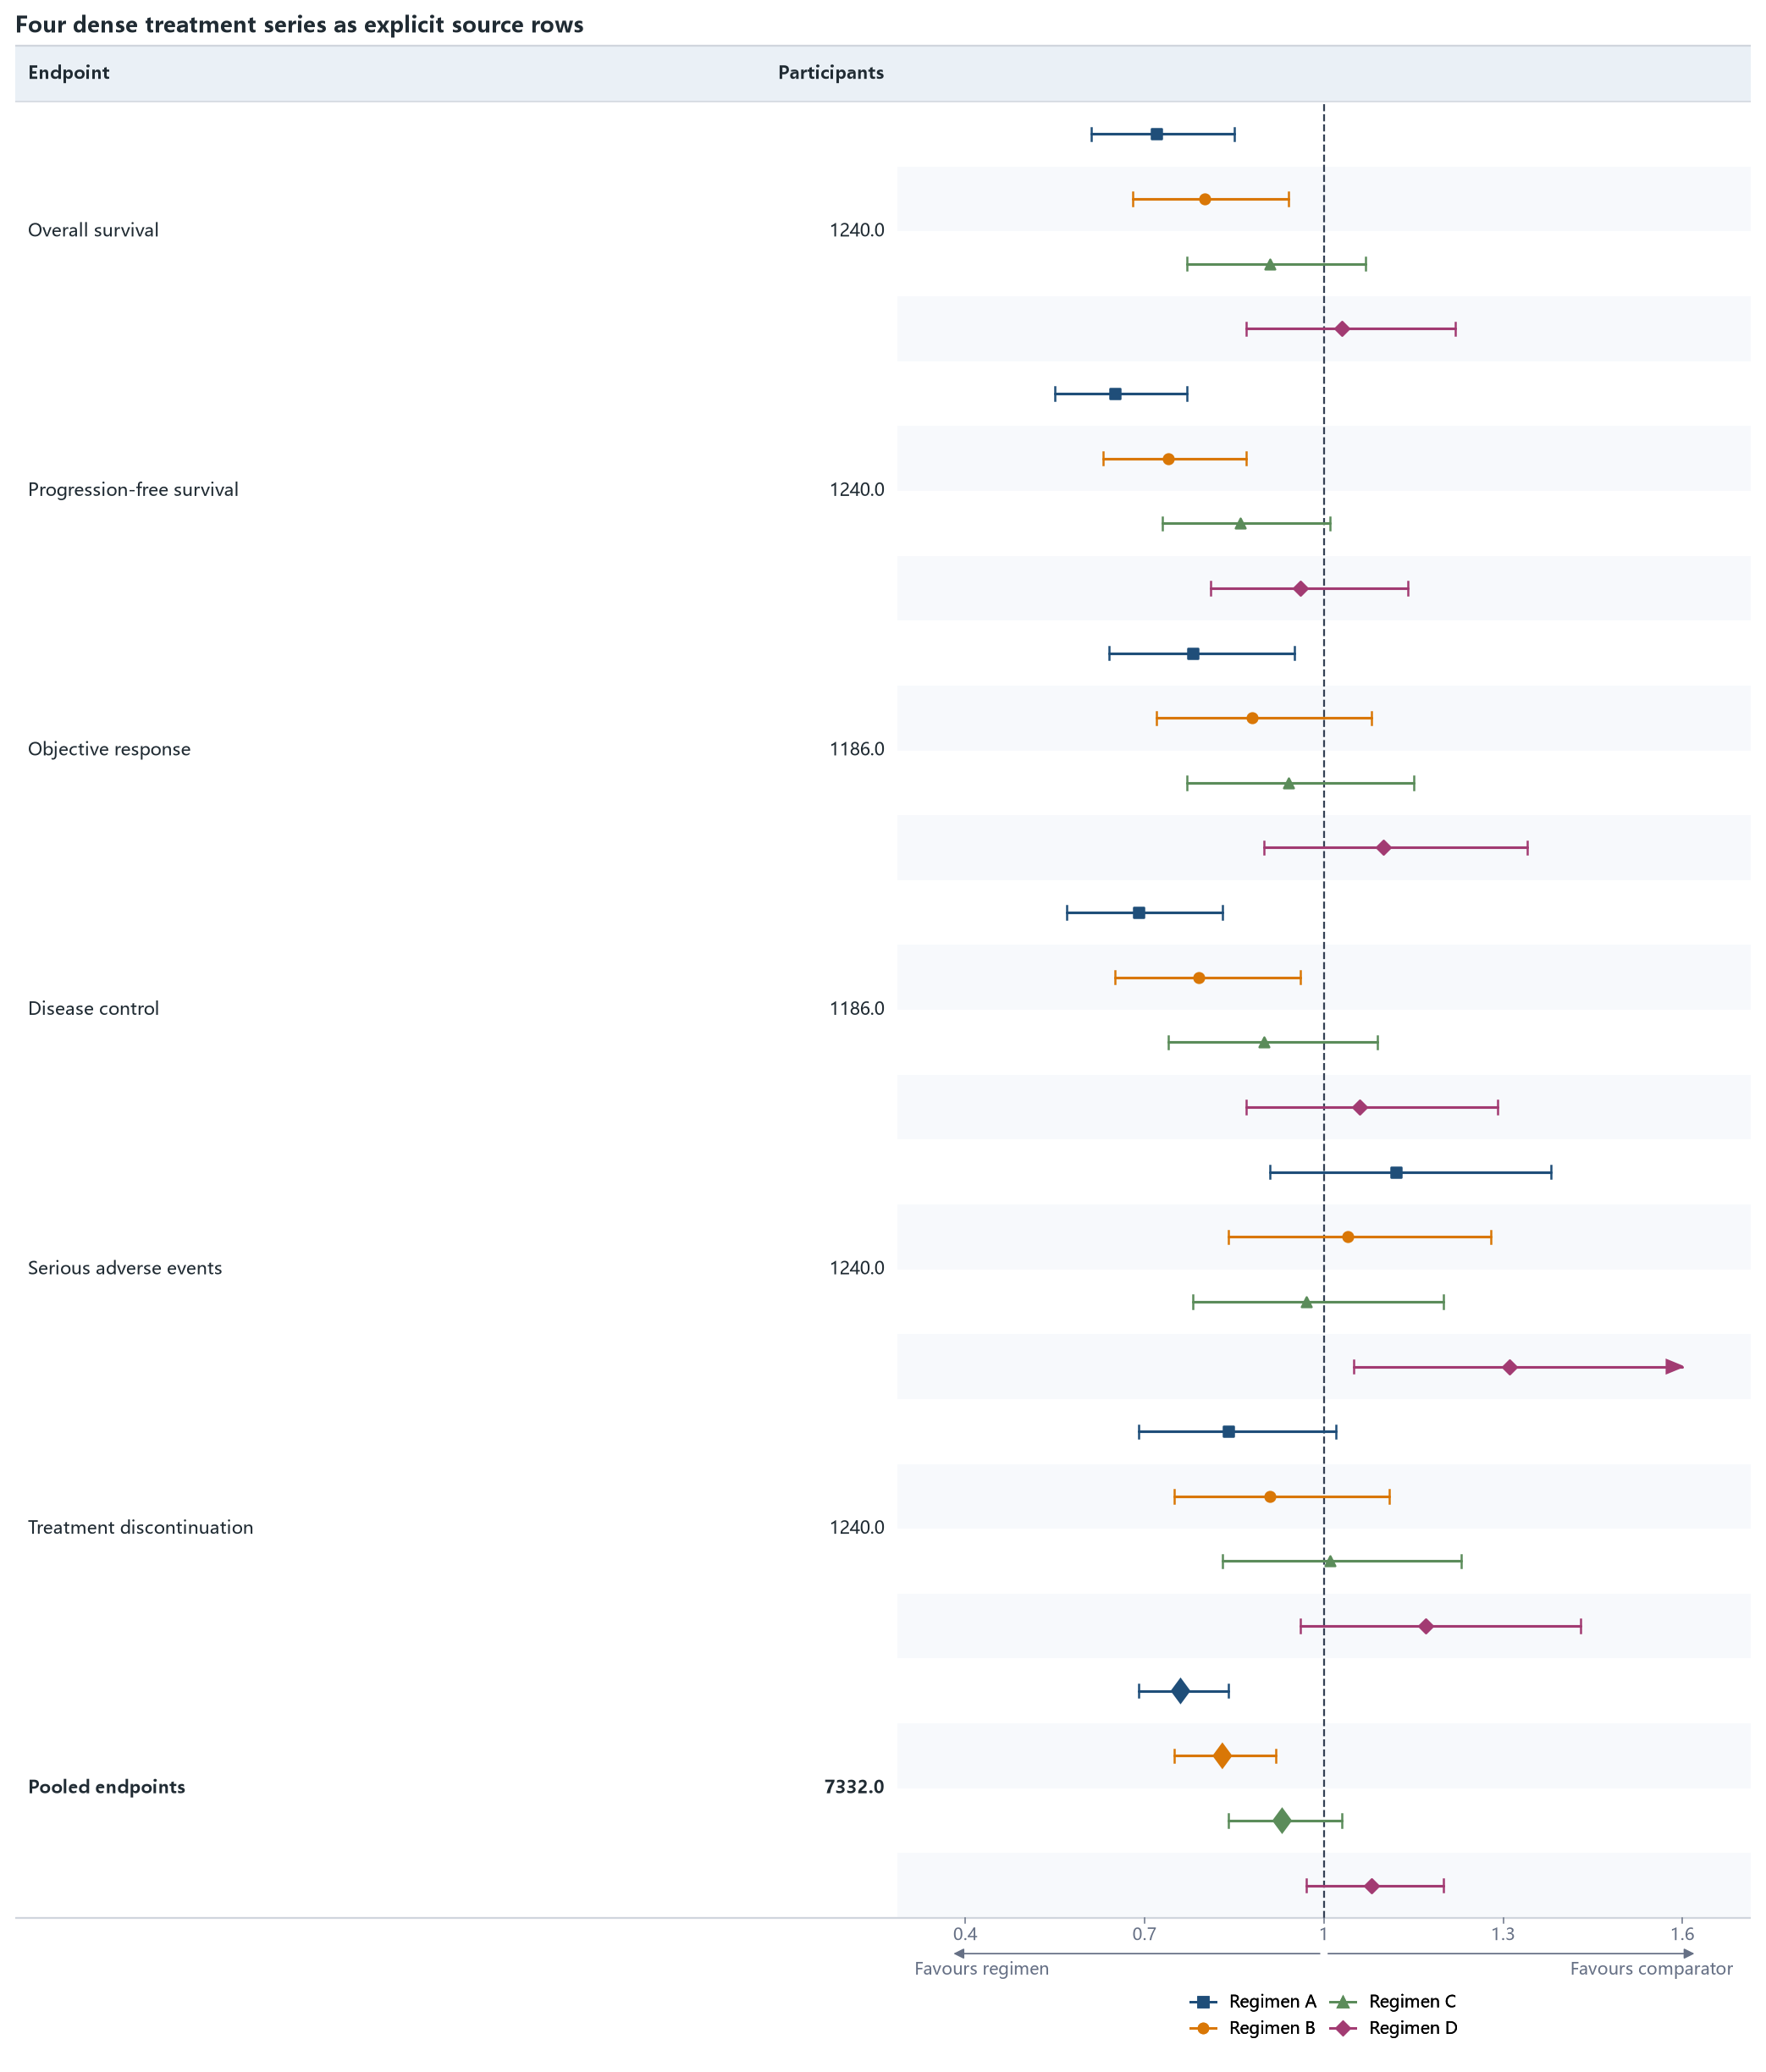
Run the example
from forestploter import read_forest_data
from forestploter.gallery_cases import plot_four_series_dense

df = read_forest_data("07_four_series_dense.xlsx", sheet_name="Forest")
result = plot_four_series_dense(df)
result.save("07_four_series_dense.png", dpi=300)
Plot function used by the gallery and tests
def plot_four_series_dense(df: ForestInput) -> ForestPlotResult:
    """Plot case 07: four dense series with a bottom legend."""

    columns = (
        ForestColumn("endpoint", "Endpoint", "text", 2.5),
        ForestColumn("participants", "Participants", "numeric", 0.8, "right"),
        ForestColumn("ci", "", "ci", 5.2, "center"),
    )
    styles = {
        "Regimen A": ForestSeriesStyle("Regimen A", "#1F4E79", marker="s"),
        "Regimen B": ForestSeriesStyle("Regimen B", "#D97706", marker="o"),
        "Regimen C": ForestSeriesStyle("Regimen C", "#5B8C5A", marker="^"),
        "Regimen D": ForestSeriesStyle("Regimen D", "#A23B72", marker="D", summary_marker="same"),
    }
    return forest(
        df,
        columns=columns,
        ref_line=1.0,
        xlim=(0.4, 1.6),
        ticks_at=(0.4, 0.7, 1.0, 1.3, 1.6),
        arrow_lab=("Favours regimen", "Favours comparator"),
        title="Four dense treatment series as explicit source rows",
        figure_width=11.5,
        series_styles=styles,
        legend=ForestLegendSpec(location="bottom", ncol=2),
    )