01 · Single series with trailing effect text
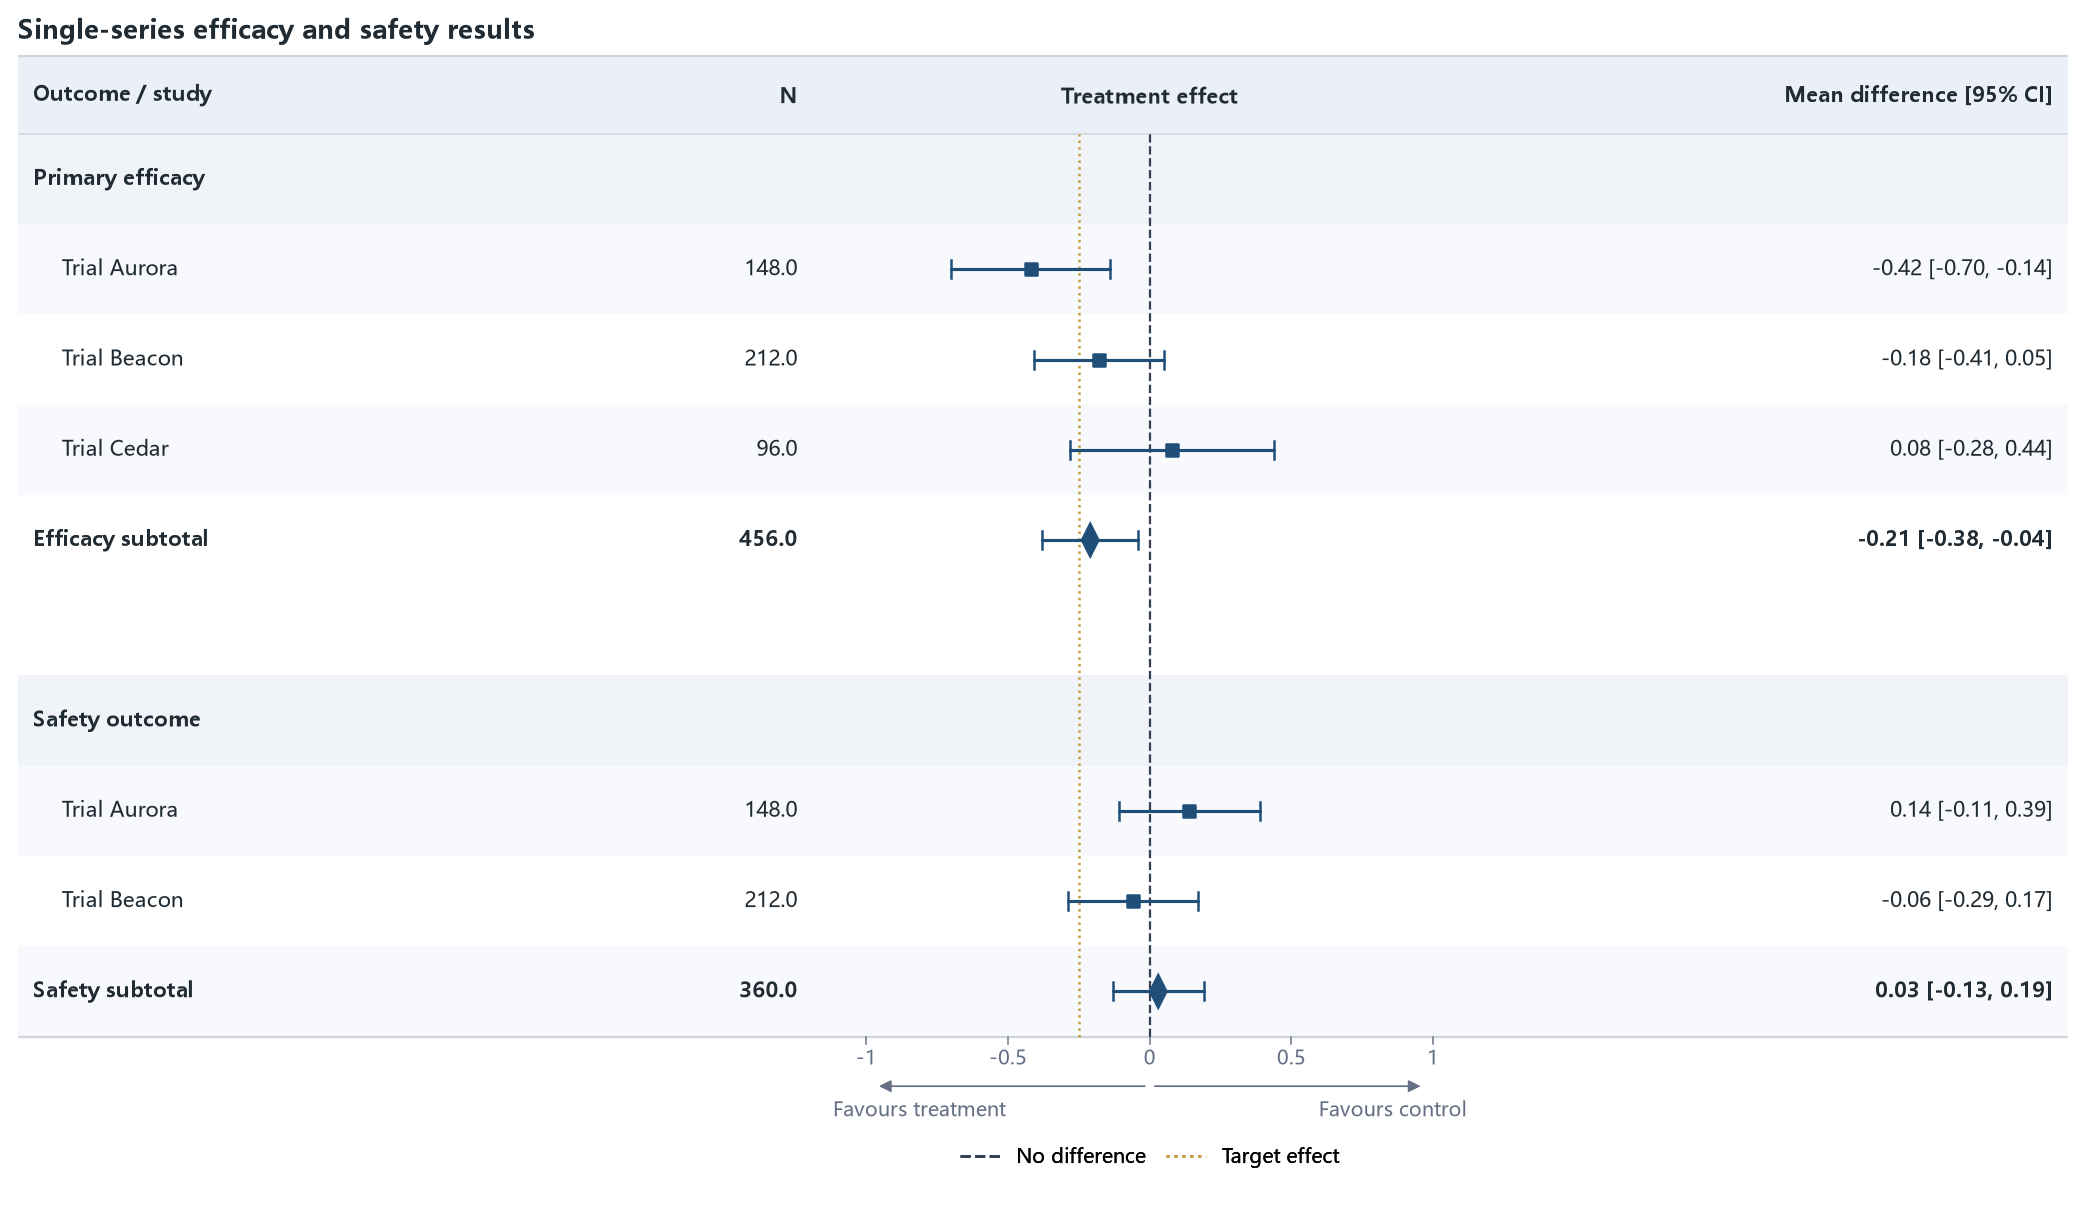
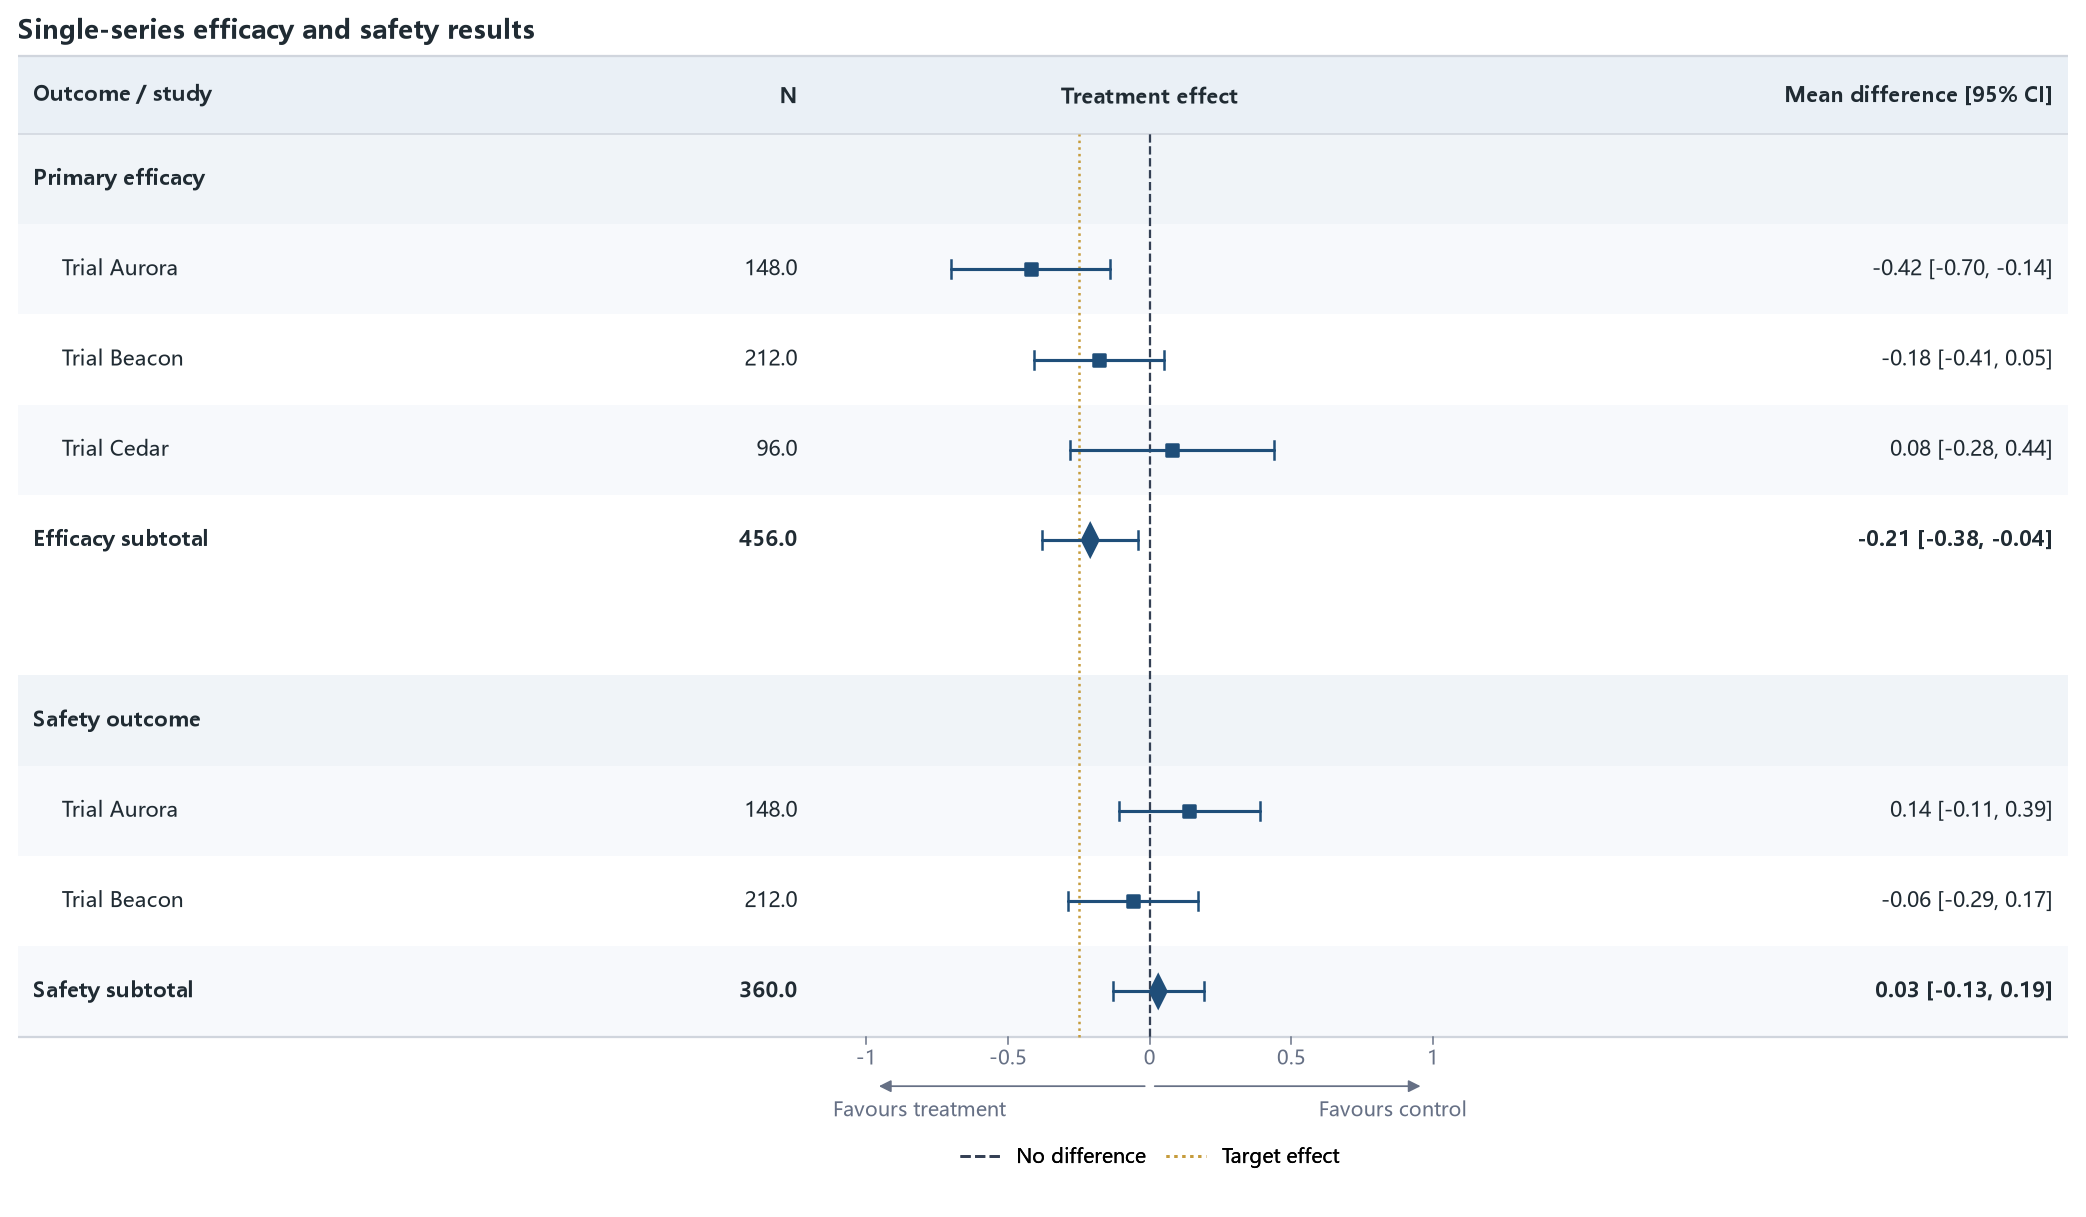
This is the formal “text → CI → text” regression case. The physical file places
estimate/lower/upper before effect_display; the columns sequence
places the CI between the study fields and the formatted effect text.
Run the example
from forestploter import read_forest_data
from forestploter.gallery_cases import plot_single_series

df = read_forest_data("01_single_series.xlsx", sheet_name="Forest")
result = plot_single_series(df)
result.save("01_single_series.png", dpi=300)
Plot function used by the gallery and tests
def plot_single_series(df: ForestInput) -> ForestPlotResult:
    """Plot case 01: display columns on both sides of the CI column."""

    columns = (
        ForestColumn("label", "Outcome / study", "text", 2.8),
        ForestColumn("n", "N", "numeric", 0.7, "right"),
        ForestColumn("ci", "Treatment effect", "ci", 3.3, "center"),
        ForestColumn("effect_display", "Mean difference [95% CI]", "numeric", 2.0, "right"),
    )
    return forest(
        df,
        columns=columns,
        ref_line=0.0,
        ideal_line=-0.25,
        xlim=(-1.0, 1.0),
        ticks_at=(-1.0, -0.5, 0.0, 0.5, 1.0),
        arrow_lab=("Favours treatment", "Favours control"),
        title="Single-series efficacy and safety results",
        figure_width=11.5,
        reference_legend=ForestReferenceLegendSpec(
            reference_label="No difference",
            ideal_label="Target effect",
            location="bottom",
            column_key="ci",
            ncol=2,
        ),
    )