02 · Three series in one CI column
Three treatment series use three source records and three explicit visual rows per outcome. Shared outcome and participant cells are vertically merged in the XLSX file.
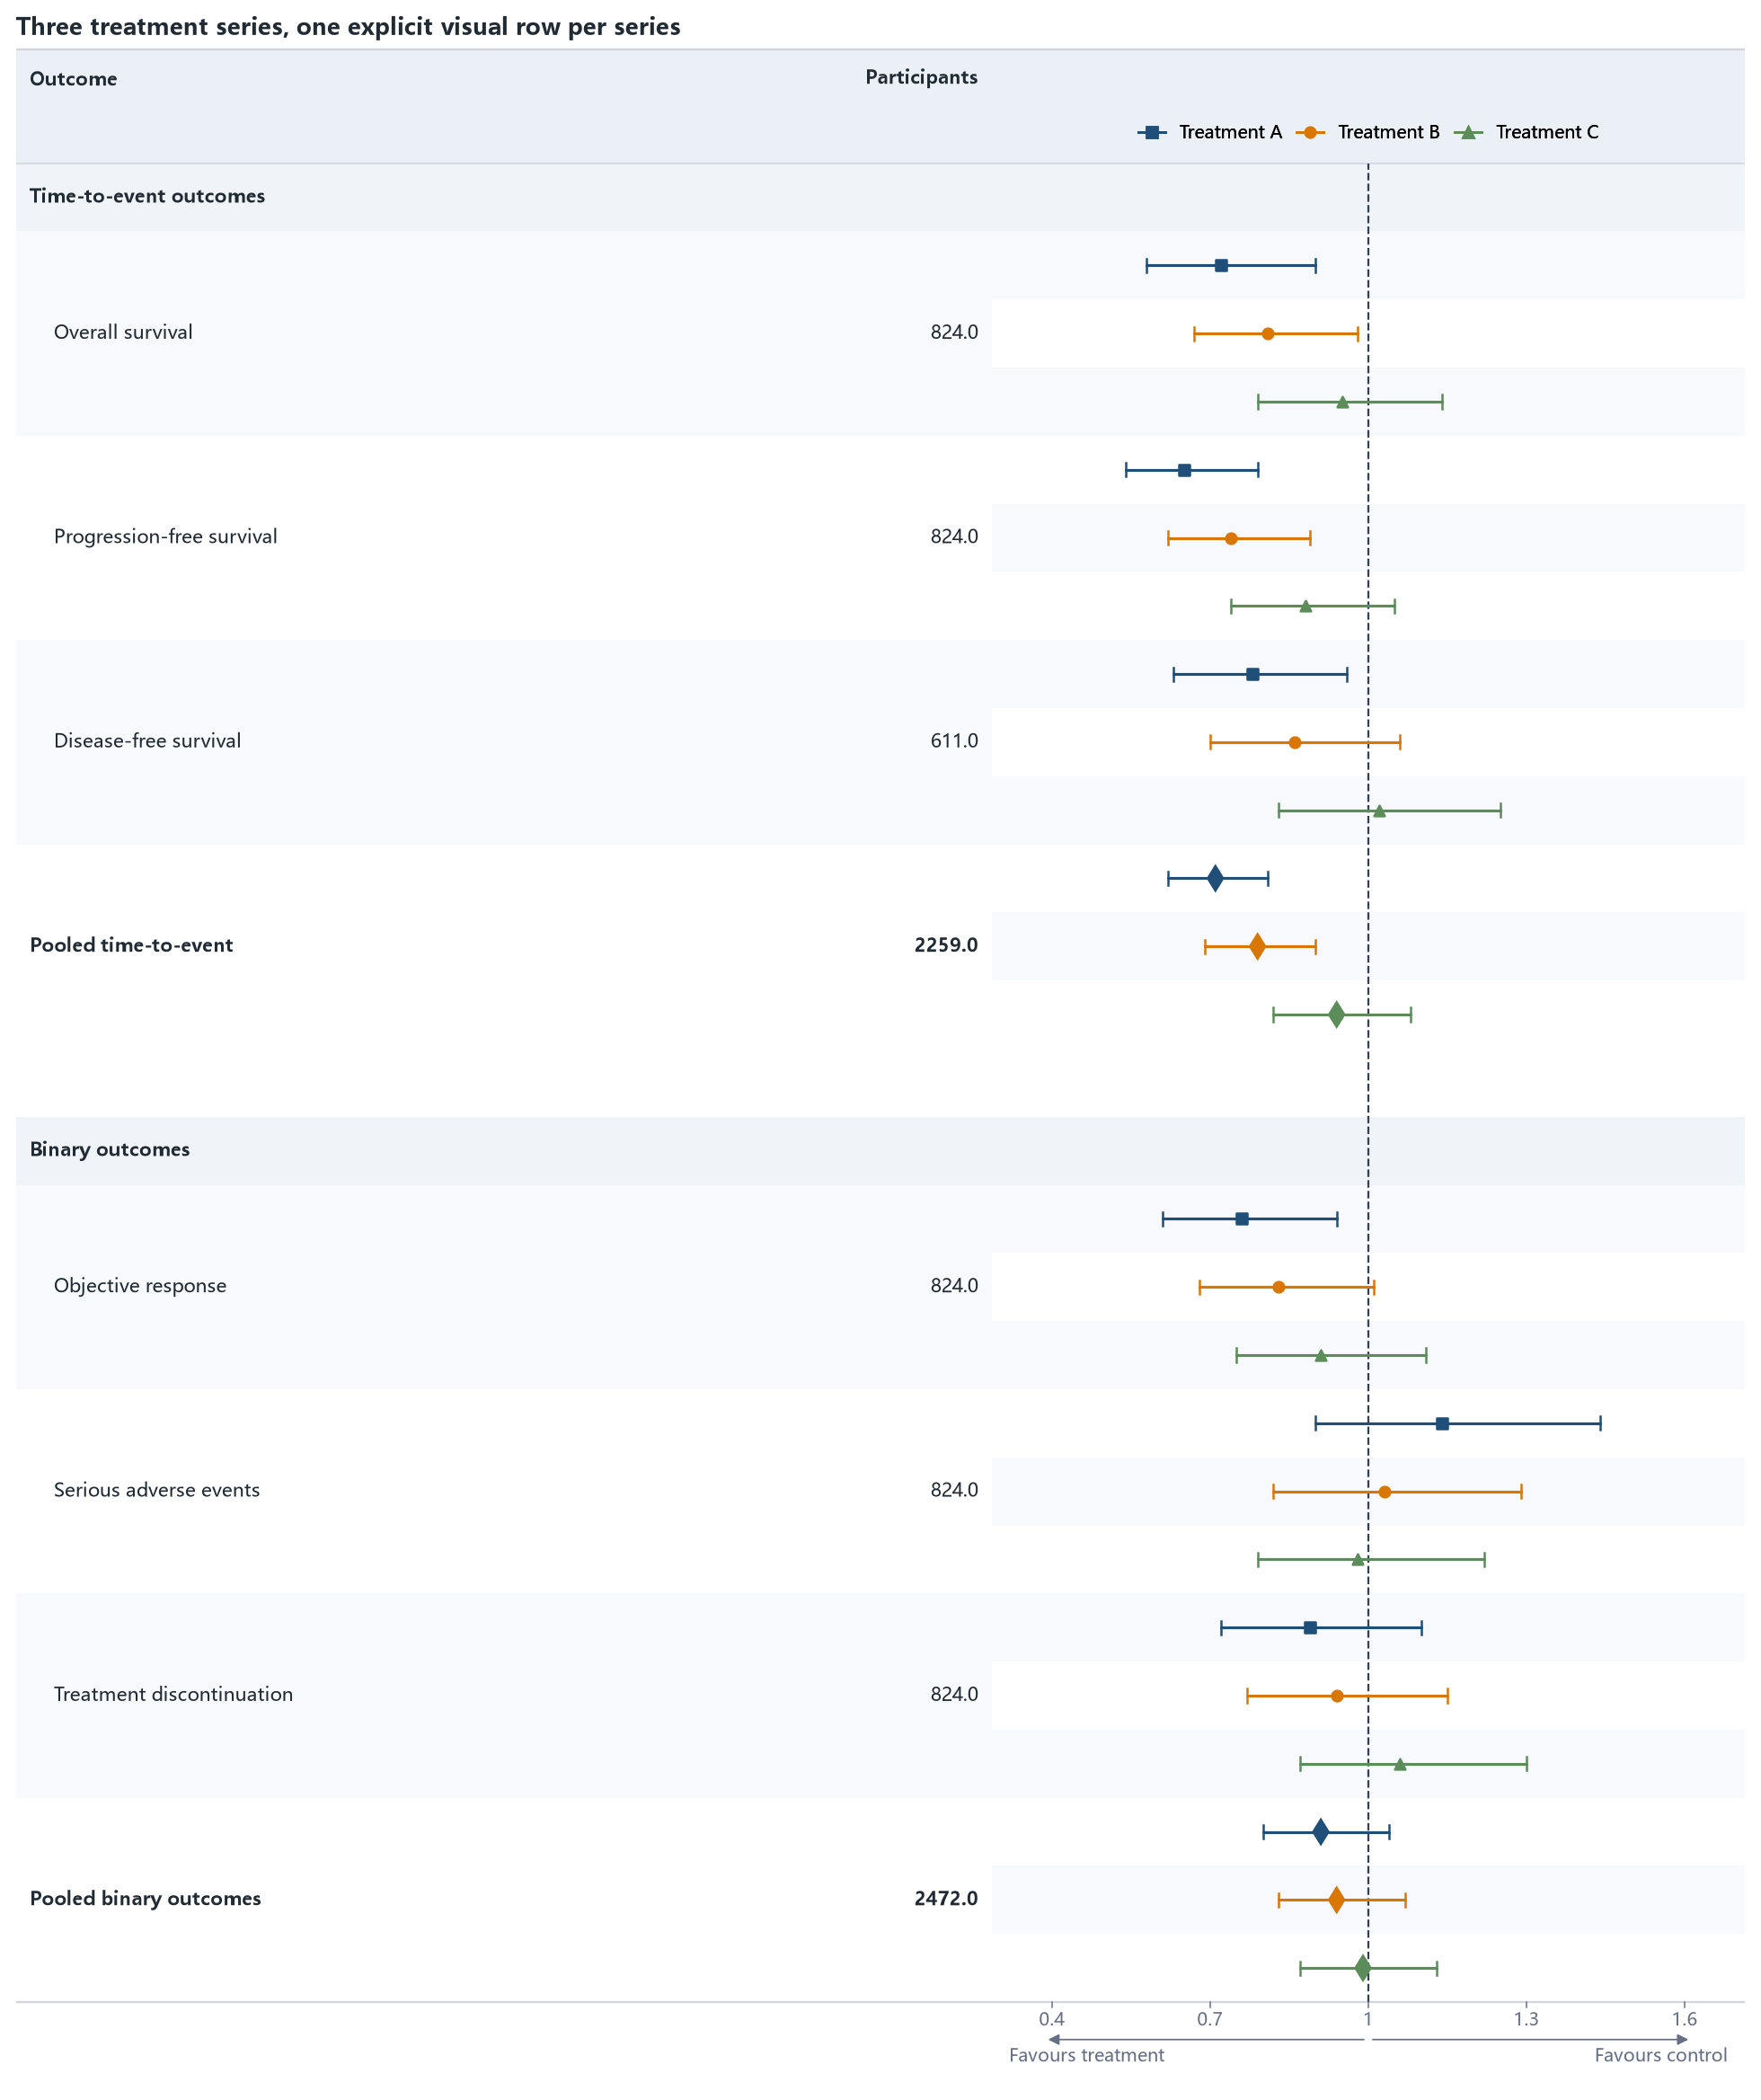
Run the example
from forestploter import read_forest_data
from forestploter.gallery_cases import plot_multi_series

df = read_forest_data("02_multi_series.xlsx", sheet_name="Forest")
result = plot_multi_series(df)
result.save("02_multi_series.png", dpi=300)
Plot function used by the gallery and tests
def plot_multi_series(df: ForestInput) -> ForestPlotResult:
    """Plot case 02: three series in one CI column."""

    columns = (
        ForestColumn("outcome", "Outcome", "text", 2.8),
        ForestColumn("participants", "Participants", "numeric", 0.9, "right"),
        ForestColumn("ci", "", "ci", 4.6, "center"),
    )
    styles = {
        "Treatment A": ForestSeriesStyle("Treatment A", "#1F4E79", marker="s"),
        "Treatment B": ForestSeriesStyle("Treatment B", "#D97706", marker="o"),
        "Treatment C": ForestSeriesStyle("Treatment C", "#5B8C5A", marker="^"),
    }
    return forest(
        df,
        columns=columns,
        ref_line=1.0,
        xlim=(0.4, 1.6),
        ticks_at=(0.4, 0.7, 1.0, 1.3, 1.6),
        arrow_lab=("Favours treatment", "Favours control"),
        title="Three treatment series, one explicit visual row per series",
        figure_width=10.8,
        series_styles=styles,
        legend=ForestLegendSpec(location="header", column_key="ci", ncol=3),
    )